Skip to content

Some essential notes on C-statistics

Basic concepts

C-statistics is based on Poisson likelihood:

L(M)=iMiDiDi!exp(Mi)

where L(M) is the likelihood for the model M, Di is the data in ith bin, Mi denotes the model prediction in ith bin. Taking its logarithm and multiplying by 2, we can get

2lnL(M)=2i(MiDilnMi+ln(Di!)).

Omitting the factorial term, we can get the Cash-statistics (Cash 1979):

C~=2i(MiDilnMi).

Approximating the factorial term by Stirling's formula, that is

ln(Di!)DilnDiDi,

a modification of the original Cash-statistic, C-statistics, can be obtained as follows:

C=2i(MiDilnMi+DilnDiDi),

which is implemented in some popular fitting packages like XSPEC (Arnaud 1996), SHERPA (Freeman et al. 2001), and SPEX (Kaastra et al. 1996). C~ is the same as C, up to a constant i(DilnDiDi). C is non-negative, C is equal to 0 if and only if all the Mi are equal to Di. Since the count rate is usually low for X-ray observation, it is better to use C-statistics fitting than χ2 fitting, i.e., getting the best-fit parameters by minimizing C instead of χ2.

1σ confidence intervals for parameters

Assuming that there are
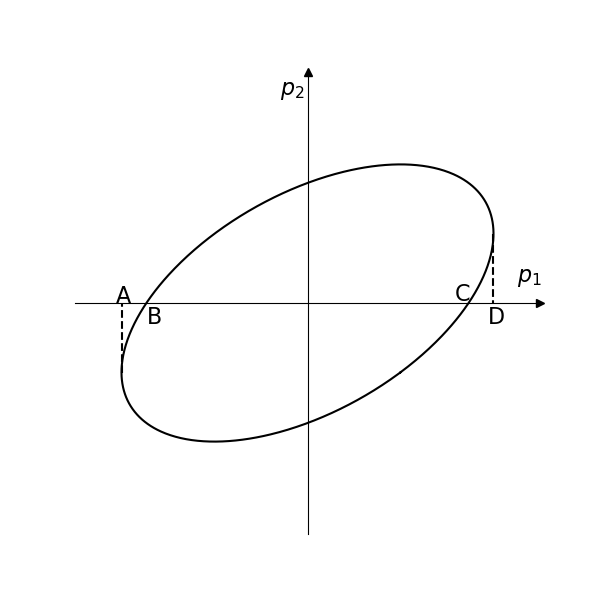
 k parameters in the model, that is p1, p2, ..., pk, a set of {pi} (i ranges from 1 to k) that results in a minimum value of C is the best-fit parameter set, i.e., the best-fit model. However, merely getting the best-fit parameter set is not enough, we also need to evaluate the 1σ confidence intervals for the parameters.

A simple schematic

For simplicity, we may as well take a model with just two parameters p1 and p2 as an example. {p1,best,p2,best} is the best-fit parameter set, which generates the minimum C, i.e., Cmin. Considering the 2D parameter space (p1,p2), C will be larger than Cmin in the neighborhood of (p1,best,p2,best). CCmin+1 defines a close region in the 2D parameter space, which is called the 1σ confidence region. C=Cmin+1 defines the corresponding boundary of the 1σ confidence region. The figure below can serve as a schematic of the 1σ confidence region in the 2D parameter space (p1,p2), which assumes that p1,best=0 and p2,best=0, or equivalently, the origin of the 2D parameter space is set to be the best-fit parameter set.

The line segment AD represents the 1σ confidence interval for p1. The line segment BC is not the 1σ confidence interval for p1. If we fix the parameter p2=p2,best=0 and calculate the error of p1 in SPEX, we will get the 1σ confidence interval for p1, which is the line segment BC. However, it is not reasonable, because there will always be some correlation between parameters. You can also find that the 1σ confidence interval for p1 obtained by setting the rest parameters to the best-fit value will always be smaller than the 1σ confidence interval for p1 obtained by freeing all the parameters (BC<AD).

Fig1

The 1σ confidence region in the 2D parameter space (p1,p2) is represented by the oblique ellipse. Points A and D denote the minimum and maximum value of p1 of the oblique ellipse, respectively. Points B and C are two points of intersection between the oblique ellipse and the horizontal line p2=p2,best=0.

The algorithm of finding the 1σ confidence interval

As shown in the Figure, you may think that we need to get the boundary, namely, the oblique ellipse first and then get the 1σ confidence interval for each parameter by projecting the oblique ellipse to each parameter axis (by getting the minimum and maximum value of each parameter). However, calculating the boundary of the oblique ellipse is not efficient. To calculate the 1σ confidence interval for the parameter p1, the algorithm implementd in SPEX goes as follows,

    1. Get the best-fit parameter set
    1. Fix the parameter p1 to a value that is close to the p1,best but free all the rest parameters.
    1. Obtain the minimum C
    1. If the minimum C is larger than Cmin+1, choose a new p1 that is closer to p1,best, if the minimum C is smaller than Cmin+1, choose a new p1 that is farther from p1,best. Go to step 2.
    1. Return the two points p1 that can result in the minimum C being equal to Cmin+1 by setting the rest parameters to be free. Actually, it is not exactly Cmin+1, there is some tolerance, the algorithm in SPEX will stop at some value that is close to Cmin+1, like Cmin+1.01.

Why the 1σ region is defined as Cmin+1?

Why it is Cmin+1 not some value like Cmin+1.2 or Cmin+1.3? It should date back to the χ2 test.

Δχ2=χ2(N)χmin2(N1)

is distributed like a χ2 variable with one degree of freedom, where N is the number of data points and χ2(N1)min is the χ2 the usual minimum fit statistic Bonamente (2019). Namely, Δχ2 is distributed as χ2(1). According to the χ2(1) distribution, Δχ21 will lead to a probability of 68%, which is the so-called 1σ confidence level. For C-statistics,

ΔC=CCmin

is approximately distributed like a χ2(1) distribution. Therefore, we also use Cmin+1 to define the 1σ confidence region.

Released under the MIT License.