Introduction
The galaxies observed were redder than normal can be interpreted as their older age or dust reddening. The UVJ diagram is a tool to distinguish between these two possibilities and is effective at separating quiescent and star-forming galaxies. The UVJ diagram is a color-color diagram that uses the rest-frame U-V and V-J colors
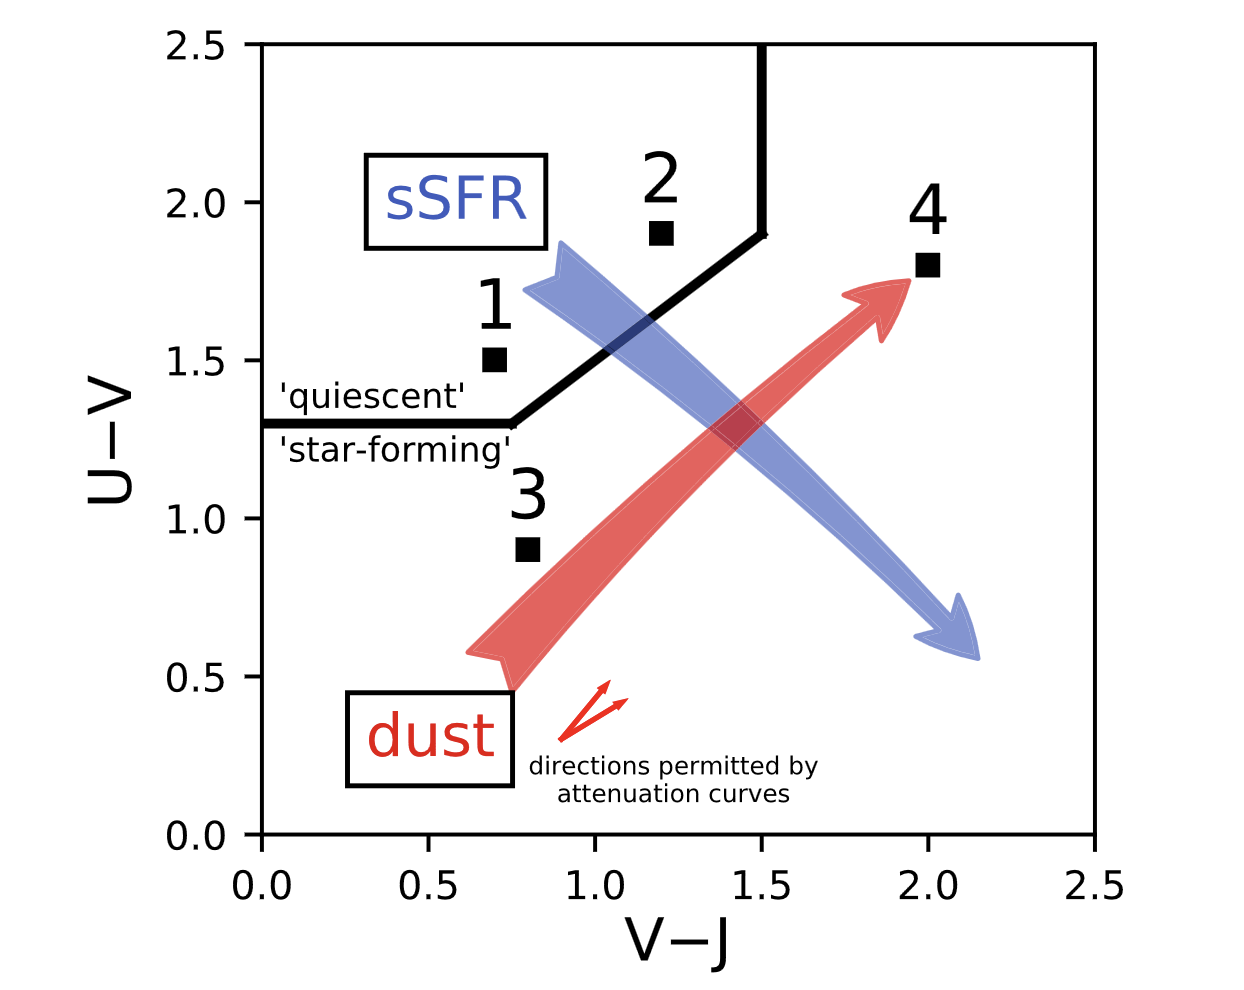
The principle of the UVJ diagram
- U band: Ultraviolet, trace the recent star formation, most sensitive to dust extinction
- V band: Visible, trace stellar mass, less sensitive to dust extinction than U band
- J band: Near-infrared, trace the older stellar population, least sensitive to dust extinction.
Given that the luminosity in the U band is mainly due to young and massive stars and the luminosity in the V band is mainly due to the total stellar mass, star-forming galaxies (with a larger sSFR) are expected to have a smaller U (more massive stars, larger
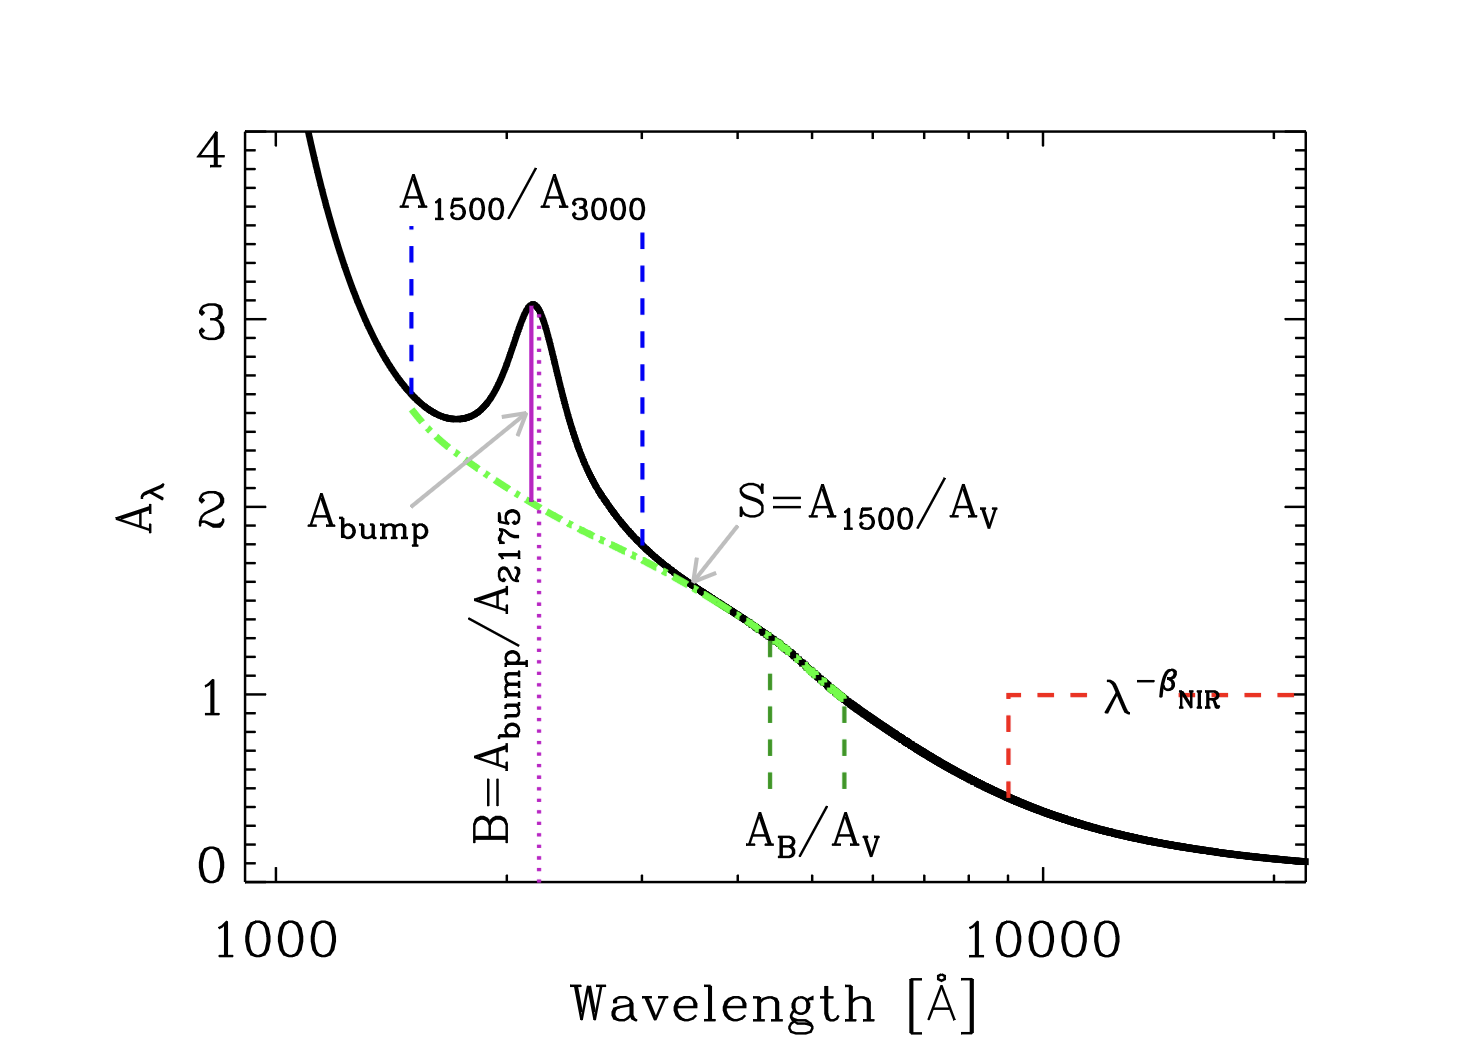
Schematic representation of an attenuation or extinction curve, from The Dust Attenuation Law in Galaxies